Daily Sea Surface Temperature

Page Overview & Data Sources
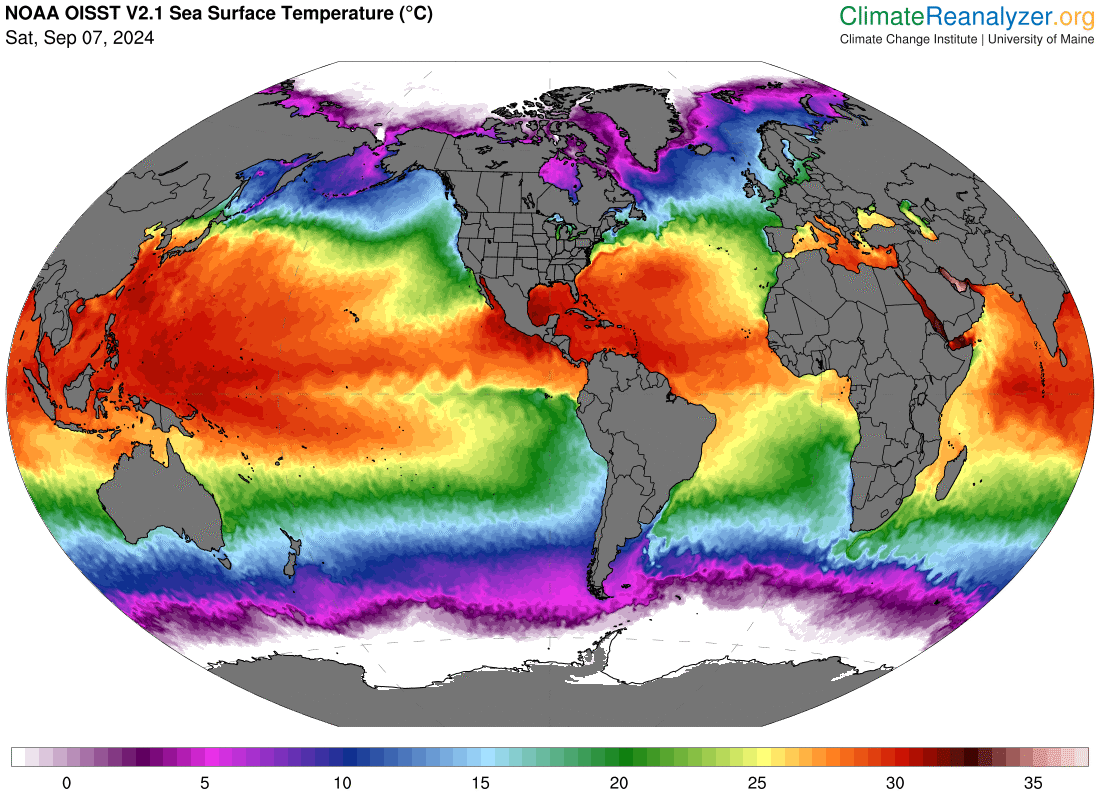
- This page provides time series and map visualizations of daily mean
Sea Surface Temperature (SST) from
NOAA Optimum Interpolation SST (OISST) version 2.1. OISST is a 0.25°x0.25°
gridded dataset that provides estimates of temperature based on a blend of satellite,
ship, and buoy observations. The datset spans 1 September 1981 to present with a 1 to
2-day lag from the current day. Data are preliminary
for about two weeks until a finalized product is posted by NOAA. This status is
identified on the maps by "preliminary" appearing in the title, and applies to the
time series as well. Learn more about OISST, including strengths and limitations,
from the
NCAR Climate Data Guide.
NOTE: The daily temperatures displayed here are estimates specific to OISST, and any apparent record high or low values in OISST should be considered with caution and evaluated against other datasets. For long-term global climate time series, refer to NOAA's National Centers for Environmental Information (NCEI) Climate at a Glance with monthly means of surface temperature observations 1850 to present. - Time series and maps: The time series chart displays area-weighted means for the
selected domain. For example, if World 60S-60N is selected, then each daily SST
value on the chart represents the average of all ocean gridcells between 60°S and 60°N
across all longitudes, and accounts for the convergence of longitudes at the poles.
World (60°S–60°N, 0–360°E) North Atlantic (0–60°N, 0–80°W) Subpolar North Atlantic (45–60°N, 20–45°W) Atlantic Hurricane MDR* (10–20°N, 20–85°W) Gulf of Maine (42–45°N, 66–71°W) Gulf of Mexico (20–30°N, 82–98°W) Niño 3.4 (5°S–5°N, 120–170°W)
*MDR = Main Development Region
Upon clicking a data point in the chart, a tooltip will display the estimated daily temperature as well as temperature anomalies relative to both 1982–2010 and 1991–2020 climatological means. The period 1991–2020 is the current 30-year climate normal recognized by NOAA and the World Meteorological Organization, and the anomaly maps use this most recent reference period. The daily climatologies are calculated from the OISST dataset.
Clicking a data point on the time series chart also updates the map. The toggle button at the lower-left of the map can be used to switch the display between temperature and temperature anomaly. OISST temperature estimates are poorly constrained over ice-covered areas in the high latitudes, therefore a sea ice mask is applied to both the SST and SST anomaly maps for gridcells where ice concentration is >= 50%. Areas of ice cover are determined using the ice concentration variable in the OISST dataset.
NCAR Command Language is used for data processing and map generation. The interactive time series chart is made using HighCharts. OISST data grids are downloaded from NCEI here.
The OISST maps shown here can be animated on the Daily Temperature, SST, & Sea Ice page.
Last updated 23 September 2024