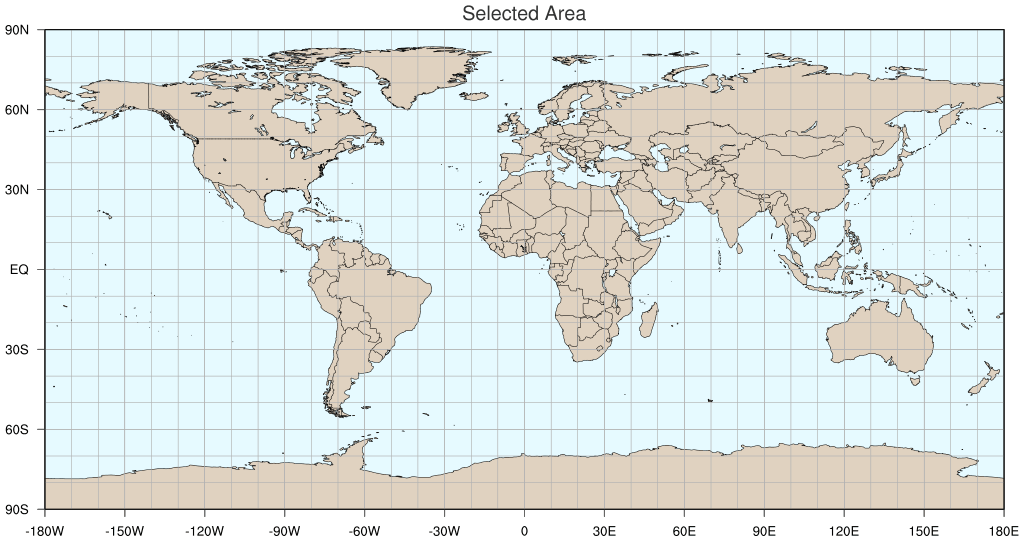
Monthly Reanalysis Time Series
Processing Data...


Climate Reanalysis
Climate reanalysis refers to physically-based numerical frameworks that simulate the state Earth's
climate through time, guided by frequent input of real-world observations (e.g., weather stations,
radiosonde, satellite, and ocean buoys). Reanalysis models are invaluable tools for understanding
climate variability and change, including across areas where direct observations are not
available. This page provides access to common meteorological variables for the most
widely used reanalysis products. Users are encouraged to learn more about reanalysis —
approach, strengths, limitations, and product comparisons — from the
NCAR Climate Data Guide. Additional information about reanalysis can be found at
Advancing Reanalysis.
-
ECMWF European Reanalysis V5 (ERA5) [0.25°x0.25°] | Downloaded from
Copernicus C3S
- The datafiles here are regridded to 0.5°x0.5° using bilinear interpolation to reduce server load and access time.
-
ECMWF European Reanalysis Interim (ERAI) [0.75°x0.75°] | Downloaded from
ECMWF
- Dataset ends August 2019. Superseded by ERA5.
-
NASA Modern-Era Retrospective Analysis for Research and Applications V2 (MERRA2) [0.5°x0.625°] | Downloaded from
GES DISC
-
JMA Japanese Reanalysis 55-year (JRA55) [0.5625°x0.5625°] | Downloaded from
NCAR RDA
-
NCEP Climate Forecast System Reanalysis (CFSR/CFSV2) [0.5°x0.5°] | Downloaded from
NCAR RDA
- Monthly means derived from daily means of 3-hourly values. CFSR ends March 2011; CFSV2 begins April 2011.
-
NCEP/NCAR Reanalysis V1 (NNR1) [2.5°x2.5°] | Downloaded from
NOAA PSL
-
NOAA/CIRES/DOE 20th Century Reanalysis V3 (20CR3) [1°x1°] | Downloaded from
NOAA PSL
-
ECMWF European Reanalysis of the 20th Century (ERA-20C) [1.125°x1.125°] | Downloaded from
ECMWF
-
BPRC Arctic System Reanalysis Version 2 (ASR2) [15km] | Downloaded from
NCAR RDA
- Model domain based on a polar stereographic projection with minimum latitudes ranging 27°N-41°N.
Gridded Observations
Gridded data products place point-based or spatially discontinuous observations of
Earth's climate (e.g., temperature, precipitation, wind, and sea surface temperature) onto
time-registered grids and fill in data gaps using methods of interpolation. As with reanalysis,
gridded datasets are useful for climate study in areas that may not have direct observations,
but where the intersection of surrounding input data can provide meaningful information. Climate
Reanalyzer provides access to several widely used gridded datasets.
-
NOAA Optimum Interpolation Sea Surface Temperature V2.1 (OISST2.1) [0.25°x0.25°] | Downloaded from
NOAA NCEI
-
NOAA Extended Reconstruction Sea Surface Temperature V5 (ERSST5) [2°x2°] | Downloaded from
NOAA NCEI
-
NOAA CPC Morphing Technique Global Precipitation Analysis (CMORPH) [0.25°x0.25°] | Downloaded from
NOAA NCEI
- Monthly totals derived from daily totals. Latitudinal data coverage 60°S-60°N.
Climate Models (Historical + Future Projections)
Climate models afford physically-based simulations of energy and material flows through
the atmosphere, ocean, and other parts of the earth system. The most complex of these frameworks
are earth system models, where multiple systems are coupled and yield dynamic interactions.
Climate and earth system models are used to investigate past, present, and future climate
evolution based on changes in radiative forcing, such as from greenhouse-gas emissions. Since
1995, the international consortium
Coupled Model Intercomparison Project (CMIP) has organized a common set of experiments for
modeling groups to use in future climate studies. CMIP 5 and 6 multi-model ensemble mean results
(near-surface temperature, precipitation, and mean sea level pressure) are available from
Climate Reanalzyer for mid- and high-warming scenarios to the year 2100. Scenarios in CMIP5 are
based on Representative Concentration Pathways (RCP), and in CMIP6 on Shared Socioeconomic
Pathways (SSP). Further explanation on CMIP5 and 6 can be found
here.
The ensemble mean CMIP 5 and 6 datafiles on this page where generated from the
KNMI Climate Explorer.
-
CMIP5 RCP 4.5 Ensemble Average [2.5°x2.5°] | Downloaded from
KNMI Climate Explorer
- Ensemble average of 42 models (one member each).
-
CMIP5 RCP 8.5 Ensemble Average [2.5°x2.5°] | Downloaded from
KNMI Climate Explorer
- Ensemble average of 39 models (one member each).
-
CMIP6 SSP2-4.5 Ensemble Average [1.25°x1.25°] | Downloaded from
KNMI Climate Explorer
- CMIP6 SSP2-4.5 radiative forcing stabilizes at 4.5 W m-2 by the year 2100
(equivalent to stabilization level of CMIP5 RCP 4.5). Refer to
O'Neill et al. (2016) for further description.
- Ensemble average of 13 models (one member each: AWI-CM-1-1-MR, BCC-CSM2-MR, CAMS-CSM1-0, CanESM5 p1, CanESM5 p2, CESM2, CESM2-WACCM,
FGOALS-g3, MCM-UA-1-0 f2, MIROC6, MIROC-ES2L f2, MRI-ESM2-0, UKESM1-0-LL f2).
-
CMIP6 SSP5-8.5 Ensemble Average [1.25°x1.25°] | Downloaded from
KNMI Climate Explorer
- CMIP6 SSP5-8.5 radiative forcing stabilizes at 8.5 W m-2 by the year 2100
(equivalent to stabilization level of CMIP5 RCP 8.5). Refer to
O'Neill et al. (2016) for further description.
- Ensemble average of 13 models (one member each: AWI-CM-1-1-MR, BCC-CSM2-MR, CAMS-CSM1-0, CanESM5 p1, CanESM5 p2, CESM2, CESM2-WACCM,
FGOALS-g3, MCM-UA-1-0 f2, MIROC6, MIROC-ES2L f2, MRI-ESM2-0, UKESM1-0-LL f2).
- The datafiles here are regridded to 0.5°x0.5° using bilinear interpolation to reduce server load and access time.
- Dataset ends August 2019. Superseded by ERA5.
- Monthly means derived from daily means of 3-hourly values. CFSR ends March 2011; CFSV2 begins April 2011.
- Model domain based on a polar stereographic projection with minimum latitudes ranging 27°N-41°N.
- Monthly totals derived from daily totals. Latitudinal data coverage 60°S-60°N.
- Ensemble average of 42 models (one member each).
- Ensemble average of 39 models (one member each).
- CMIP6 SSP2-4.5 radiative forcing stabilizes at 4.5 W m-2 by the year 2100 (equivalent to stabilization level of CMIP5 RCP 4.5). Refer to O'Neill et al. (2016) for further description.
- Ensemble average of 13 models (one member each: AWI-CM-1-1-MR, BCC-CSM2-MR, CAMS-CSM1-0, CanESM5 p1, CanESM5 p2, CESM2, CESM2-WACCM, FGOALS-g3, MCM-UA-1-0 f2, MIROC6, MIROC-ES2L f2, MRI-ESM2-0, UKESM1-0-LL f2).
- CMIP6 SSP5-8.5 radiative forcing stabilizes at 8.5 W m-2 by the year 2100 (equivalent to stabilization level of CMIP5 RCP 8.5). Refer to O'Neill et al. (2016) for further description.
- Ensemble average of 13 models (one member each: AWI-CM-1-1-MR, BCC-CSM2-MR, CAMS-CSM1-0, CanESM5 p1, CanESM5 p2, CESM2, CESM2-WACCM, FGOALS-g3, MCM-UA-1-0 f2, MIROC6, MIROC-ES2L f2, MRI-ESM2-0, UKESM1-0-LL f2).
Last updated 2 October 2024


