Daily Surface Air Temperature

Page Overview & Data Sources
-
This page provides time series and map visualizations of daily mean
surface air temperature (2-meter height) estimates from the
ECMWF Reanalysis version 5 (ERA5) for the period January 1940 to
present (see ERA5 attribution below). ERA5 is a state-of-the-art
numerical climate/weather modeling framework that ingests surface, radiosonde, and satellite
observations to estimate the state of the atmosphere through time. The visualizations
on this page enable users to explore weather-driven temperature changes within specific
years, while also having several decades of daily data for broader climate context.
Users are encouraged to learn more about reanalysis — approach, strengths,
limitations, and product comparisons — from the
NCAR Climate Data Guide. Additional information about reanalysis can be found at
Advancing Reanalysis.
NOTE: This content is intended for general analysis only. Any apparent record high or low daily temperatures estimated by ERA5 should be considered with caution and validated against weather station observations and other climate data products. Regarding high global mean temperatures in July 2023, Copernicus C3S and the World Meteorological Organization issued this statement. The NOAA National Centers for Environmental Information (NCEI) made a similar assessment.
A comparison of annual temperature anomaly time series for ERA5 and other datasets can be found here. Additional information about ERA5, including strengths and limitations, is available from the NCAR Climate Data Guide. Users are also encouraged to check out NOAA NCEI's Climate at a Glance for monthly, seasonal, and annual surface temperature anomaly estimates 1850 to present. -
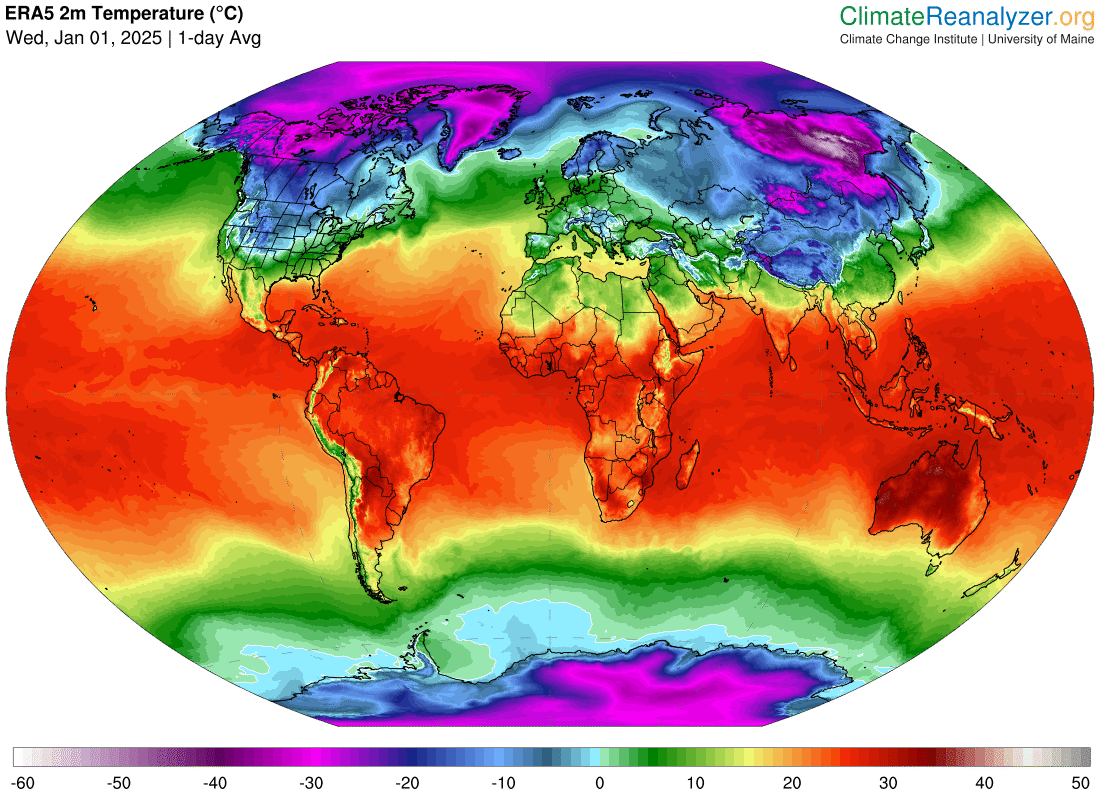
Time series and maps: The global temperature maps (Winkel Tripel projection) on
this page show daily means calculated across eight hourly timeslices (00, 03, 06, 09, 12,
15, 18, 2100 UTC) from ERA5. In turn, the time series chart displays area means that are
subset from the global time-averaged grids (see the domains listed below). ERA5 has a
horizontal gridcell resolution of 0.25° x 0.25° (about 31km x 31km at 45°N).
The area means are weighted, such that all model gridcells within the selected domain are
averaged and account for the convergence of longitude lines at the poles.
World (90°S–90°N, 0–360°E) Northern Hemisphere (0–90°N, 0–360°E) Southern Hemisphere (0–90°S, 0–360°E) Arctic (66.5–90°N, 0–360°E) Antarctic (66.5–90°S, 0–360°E) Tropics (23.5°S–23.5°N, 0–360°E)
Upon clicking a data point in the chart, a tooltip will display the estimated daily temperature as well as temperature anomalies relative to both 1979–2000 and 1991–2020 climatological means. The period 1991–2020 is the current 30-year climate normal recognized by NOAA and the World Meteorological Organization. The temperature anomaly maps likewise reference 1991–2020 climatology.
Clicking a data point on the time series chart for a specific day also updates the map. Switch the map between temperature and temperature anomaly by clicking the toggle button at lower-left.
The content on this page updates daily by about 1200 UTC with a lag time of 6 or 7 days from the current date due to ERA5's availability from Copernicus C3S.
NCAR Command Language is used for data processing and map generation. The interactive time series chart is made with HighCharts.
The ERA5 maps shown here can be animated on the Daily Temperature, SST, & Sea Ice page.
ERA5 Attribution
-
Data Source: Copernicus Climate Change Service (C3S) (2023): ERA5
hourly data on single levels from 1940 to present. Copernicus Climate Change Service
(C3S) Climate Data Store (CDS). 10.24381/cds.adbb2d47 (Accessed daily 2024).
Data Citation: Hersbach, H., Bell, B., Berrisford, P., Biavati, G., Horányi, A., Muñoz Sabater, J., Nicolas, J., Peubey, C., Radu, R., Rozum, I., Schepers, D., Simmons, A., Soci, C., Dee, D., Thépaut, J-N. (2018): ERA5 hourly data on single levels from 1940 to present. Copernicus Climate Change Service (C3S) Climate Data Store (CDS). 10.24381/cds.adbb2d47 (Accessed daily 2024).
Disclaimer: Contains modified Copernicus Climate Change Service information 2023. Neither the European Commission nor ECMWF is responsible for any use that may be made of the Copernicus information or data it contains.
Last updated 23 September 2024