This page shows northern and southern hemisphere daily sea-ice extent timeseries and
concentration maps estimated from satellite data onward from late 1978. The timeseries
source is the
Sea Ice Index
developed by the National Snow and Ice Data Center (NSIDC).
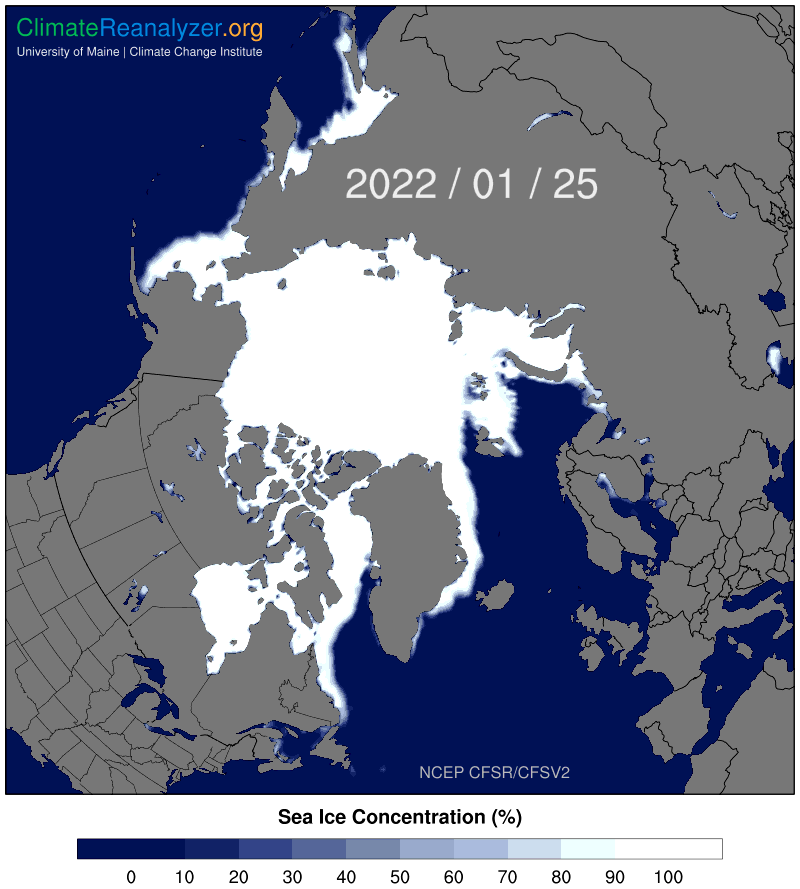
Each daily value represents a 5-day mean to smooth noise in the satellite data. The
sea-ice concentration maps are generated from 0.5°x0.5° analysis fields from the
NCEP Climate Forecast System. Click the cursor on a timeseries data
value to update the corresponding map. NSIDC maintains a web interface for
the Sea Ice Index here.
Data and maps on this page are updated daily with a one-day lag from observations.
The sea ice concentration maps also can be animated on the
Daily Reanalysis Maps
page.
NCAR Command Language is used
for data processing and map generation. The interactive time series chart is made using
HighCharts.